> ## Documentation Index
> Fetch the complete documentation index at: https://autonomy.computer/docs/llms.txt
> Use this file to discover all available pages before exploring further.
# Swarms of on-call agents
> Deploy swarms of autonomous on-call agents that safely diagnose and fix production problems.
[1Password and Autonomy collaborated](https://1password.com/blog/how-to-build-secure-agent-swarms-that-power-autonomous-systems) on AI SRE agents that safely diagnose and autonomously fix problems in production infrastructure. This guide shows you how to deploy them to your infra.
Agent swarms require execution environments with explicit identity and strict boundaries. Autonomy treats agent identity and isolation as first-class concerns. Each agent has a unique cryptographic identity, and every action is attributable by design. In this guide, we show how agents authenticate as themselves, request access dynamically, and receive credentials from [1Password](https://1password.com/) that are scoped to intent, time-bound, and revocable.
 When you go on-call, the agent requests read-only credentials from 1Password to monitor your infrastructure. A human approves access, and the agent starts watching for anomalies.
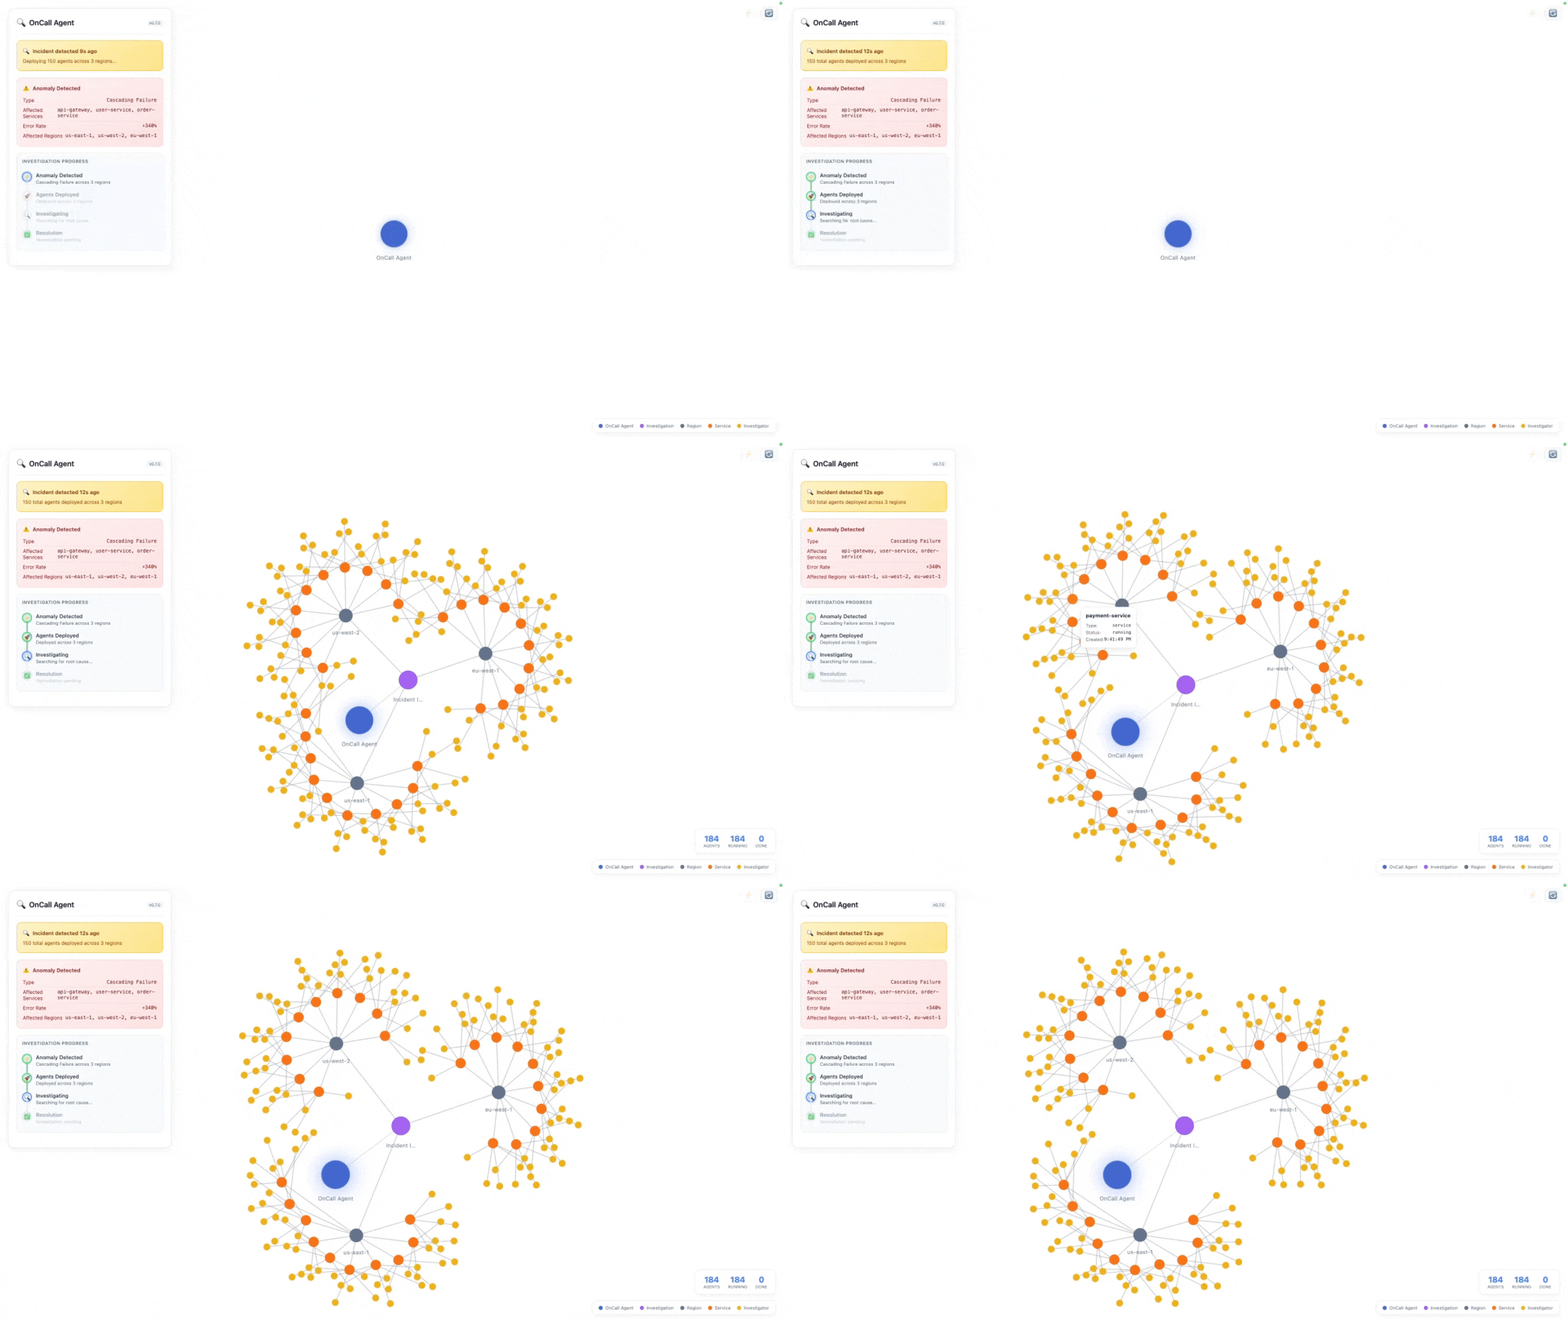
When an incident occurs, a swarm of 150+ agents spins up: some inspect logs, others correlate metrics, others evaluate fixes. Each agent has its own cryptographic identity and uses the pre-approved read credentials to investigate.
```text theme={null}
Go On-Call (Read Approval) → Monitor
→ Incident → Investigate (150+ agent swarm) → Write Approval → Remediate
```
After the swarm identifies the root cause, it requests write credentials for specific remediation actions:kill runaway queries, disable a feature flag. Each write action requires separate human approval. Once approved, the swarm autonomously remediates the problem.
Here's what that looks like in code. The investigation spawns a swarm of specialist agents across every region and service, then synthesizes their findings:
```python /dev/null/conceptual.py theme={null}
from autonomy import Agent, Model, Tool
# ...
# 3 regions × 10 services × 5 specialists = 150 diagnostic agents
regions = ["us-east-1", "us-west-2", "eu-west-1", ...]
services = ["api-gateway", "user-service", "order-service", ...]
specialists = ["database", "cache", "network", "resources", "logs"]
# Each specialist type has its own diagnostic tools
def tools_for(specialist):
# database → query connections, find slow queries
# cache → check hit rates, memory pressure
# network → check latency, packet loss
# resources → check CPU, memory, disk
# logs → search for errors, trace requests
return [...]
# Define an agent and start investigation
async def investigator_agent(specialist, service, region, incident):
agent = await Agent.start(
node,
instructions=f"You're a {specialist} diagnostic agent for {service} in {region}...",
model=Model("claude-sonnet-4-5"),
tools=tools_for(specialist),
)
return await agent.send(f"Investigate {incident}")
# 150 specialized agents, operating in a parallel scatter/gather pattern
findings = await asyncio.gather(*[
investigator_agent(specialist, service, region, incident)
for region in regions for service in services for specialist in specialists
])
```
The complete source code is available in [Autonomy examples](https://github.com/build-trust/autonomy/tree/main/examples/oncall).
***
## Try it
Complete the [steps to get started](/docs/get-started) with Autonomy.
```bash /dev/null/terminal.sh theme={null}
curl -sL https://github.com/build-trust/autonomy/archive/refs/heads/main.tar.gz | \
tar -xz --strip-components=2 autonomy-main/examples/oncall
cd oncall
```
This creates the following structure:
```text File Structure: theme={null}
oncall/
|-- autonomy.yaml
|-- secrets.yaml.example
|-- images/
|-- main/
|-- Dockerfile
|-- requirements.txt
|-- main.py # FastAPI + Monitoring Agent + Diagnostic Swarm
|-- index.html # Real-time D3.js visualization dashboard
|-- op-connect/ # 1Password Connect server
```
Create `secrets.yaml` with your 1Password Connect token:
```bash /dev/null/terminal.sh theme={null}
cp secrets.yaml.example secrets.yaml
```
```yaml secrets.yaml theme={null}
OP_CONNECT_TOKEN: "your_1password_connect_token_here"
```
Add your 1Password Connect credentials file. In the [1Password developer portal](https://developer.1password.com/), create a Connect server and download the credentials file. Save it to:
```text /dev/null/path.txt theme={null}
images/op-connect/1password-credentials.json
```
This file is gitignored and required for the 1Password Connect container to authenticate with your vault.
```bash /dev/null/terminal.sh theme={null}
autonomy
```
Once deployed, open your zone URL in a browser to access the incident response dashboard.
```bash /dev/null/terminal.sh theme={null}
# Trigger a cascading failure scenario
curl -X POST https://YOUR-ZONE-URL/incidents \
-H "Content-Type: application/json" \
-d '{"anomaly_type": "cascading_failure", "severity": "critical"}'
```
Watch the dashboard as 150+ agents spawn and investigate the incident in real-time.
***
## How it works
The application demonstrates a complete incident response workflow with secure credential handling.
**Monitor.** A long-running `Monitor` starts when the app deploys and continuously watches for anomalies. In production, it would poll Prometheus, CloudWatch, or other metrics sources. For demos, anomalies are triggered via the `/incidents` endpoint.
```python images/main/main.py theme={null}
class Monitor:
"""Watches for anomalies and spawns diagnostic investigations."""
async def start(self, node: Node):
self.node = node
self.running = True
self._monitor_task = asyncio.create_task(self._monitor_loop())
async def _monitor_loop(self):
"""Background loop that checks metrics. In production, polls Prometheus/CloudWatch."""
while self.running:
# In production: check metrics here and call trigger_anomaly() when thresholds exceeded
await asyncio.sleep(30)
```
**Two-phase credential approval.** The system uses a two-phase approach to balance investigation speed with security:
**Phase 1: READ credentials** : When you go on-call, the agent requests read-only credentials to monitor infrastructure. These are approved once at activation and shared across all diagnostic agents when an incident occurs.
```python images/main/main.py theme={null}
# READ credentials needed for monitoring (requested at activation)
MONITORING_READ_CREDENTIALS = [
"op://Infrastructure/prod-db-readonly/password",
"op://Infrastructure/prod-db-readonly/username",
"op://Infrastructure/prod-db-readonly/server",
"op://Infrastructure/aws-cloudwatch/credential",
"op://Infrastructure/k8s-prod-readonly/credential",
]
```
**Phase 2: WRITE credentials** : After diagnosis, if the swarm identifies remediation actions (kill queries, disable feature flags), it requests write credentials for each specific action. These require individual human approval.
```python images/main/main.py theme={null}
# WRITE credentials - require separate approval per action
CREDENTIAL_CATEGORIES: Dict[str, CredentialCategory] = {
# READ credentials - approved once, shared across investigation
"op://Infrastructure/prod-db-readonly/password": CredentialCategory.READ,
# ...
# WRITE credentials - require separate approval per action
"op://Infrastructure/prod-db-rwaccess/username": CredentialCategory.WRITE,
"op://Infrastructure/prod-db-rwaccess/password": CredentialCategory.WRITE,
"op://Infrastructure/config-service/credential": CredentialCategory.WRITE,
}
```
**Parallel diagnostic swarm.** Agents are actors in the Autonomy runtime:they don't block, allowing massive parallelism on a single machine. The investigation spawns specialized agents across regions and services:
```text theme={null}
Investigation Root
|
|-- us-east-1 (Region)
| |-- api-gateway
| | |-- database-agent
| | |-- cache-agent
| | |-- network-agent
| | |-- resources-agent
| | |-- logs-agent
| |-- user-service (5 agents)
| |-- order-service (5 agents)
| |-- ... (10 services × 5 agents = 50 agents)
|
|-- us-west-2 (Region) - 50 agents
|-- eu-west-1 (Region) - 50 agents
|
|-- Synthesis Agent (combines all findings)
```
Each specialist agent has specific diagnostic tools:
| Agent | Focus | Tools |
| ------------- | ------------------------------ | ------------------------------------------------- |
| **database** | Connection pools, slow queries | `query_db_connections`, `query_slow_queries` |
| **cache** | Hit rates, memory pressure | `check_cache_health`, `get_eviction_stats` |
| **network** | Latency, packet loss | `check_network_latency`, `trace_route` |
| **resources** | CPU, memory, disk | `get_cloudwatch_metrics`, `check_instance_health` |
| **logs** | Errors, traces | `get_application_logs`, `search_errors` |
**Synthesis and remediation.** After all diagnostic agents complete, a synthesis agent combines findings and identifies the root cause:
```python images/main/main.py theme={null}
async def run_swarm_diagnosis(node, problem, session_id, root_id, credentials):
"""Run parallel diagnosis across all regions and services.
Spawns 150+ diagnostic agents (3 regions × 10 services × 5 agent types)
all running in parallel. Agents are actors, so they don't block.
"""
targets = []
for region in REGIONS:
for service in SERVICES:
targets.append({"service": service, "region": region, ...})
# Run ALL targets in parallel - agents are actors, they don't block
results = await asyncio.gather(*[run_target(t) for t in targets])
return results
```
Each diagnostic agent runs with specialized instructions and tools:
```python images/main/main.py theme={null}
async def run_single_agent(self, agent_type, instructions, service_name, region, model):
"""Run a single diagnostic agent."""
agent = await Agent.start(
node=self.node,
instructions=f"""You are a {agent_type} diagnostic agent for {service_name} in {region}.
{instructions}
Provide a brief assessment of the {agent_type} health for this service.""",
model=model,
)
message = f"Diagnose {agent_type} health for {service_name} in {region}."
responses = await agent.send(message)
return {
"agent_type": agent_type,
"status": "completed",
"finding": responses[-1].content.text
}
```
After all diagnostic agents complete, a synthesis agent combines findings:
```python images/main/main.py theme={null}
synthesis_agent = await Agent.start(
node=self.node,
instructions="""You are a senior SRE synthesizing diagnostic findings.
Identify common patterns, determine root cause, and prioritize remediation.
List any actions requiring WRITE access as "Actions Requiring Approval".""",
model=Model("claude-sonnet-4-5"),
)
diagnosis = await synthesis_agent.send(
f"Synthesize findings: {findings_summary}"
)
```
If the synthesis identifies remediation actions, the agent requests write credentials with individual human approval for each action.
The dashboard includes a real-time D3.js force-directed graph that visualizes all agents as they spawn, investigate, and complete their work.
**POST /incidents** : Trigger an incident investigation with 150+ diagnostic agents.
**Request:**
```json /dev/null/request.json theme={null}
{
"anomaly_type": "cascading_failure",
"severity": "critical",
"message": "Optional custom message"
}
```
**Response:**
```json /dev/null/response.json theme={null}
{
"status": "pending",
"message": "Anomaly reported - monitoring agent analyzing metrics...",
"anomaly_type": "cascading_failure"
}
```
**GET /investigation/status** : Get the current investigation status.
**Response:**
```json /dev/null/response.json theme={null}
{
"active": true,
"investigation": {
"investigation_id": "abc123",
"status": "running",
"anomaly_type": "cascading_failure",
"anomaly_message": "Detected cascading failure...",
"agents_count": 150,
"session_id": "def456",
"created_at": "2024-01-15T10:30:00Z"
},
"message": "Investigation abc123 is running"
}
```
**POST /approve/** : Approve or deny credential access for an investigation.
**Request:**
```json /dev/null/request.json theme={null}
{
"approved": true
}
```
**Response (streaming):** Events indicating credential retrieval, agent spawning, and diagnosis progress.
Additional endpoints for visualization (`/graph`), history (`/investigation/history`), and health checks (`/health`) are available in the [source code](https://github.com/build-trust/autonomy/tree/main/examples/oncall).
***
## Customize for your infrastructure
The example uses mock tools and manual triggers for demonstration. To adapt for your infrastructure:
* **Connect your monitoring** : Replace the manual `/incidents` trigger with your observability stack. The `Monitor._monitor_loop()` can poll Prometheus, CloudWatch, or Datadog for anomalies.
* **Implement real diagnostics** : Replace mock tool functions with actual infrastructure queries. For example, `query_db_connections` becomes a real PostgreSQL connection pool query, `get_cloudwatch_metrics` uses the AWS SDK.
* **Map your infrastructure** : Update `REGIONS` and `SERVICES` to match your actual deployment topology. Add specialists for your stack (Redis, Kafka, etc.).
* **Configure 1Password** : Set up vaults with your infrastructure credentials. The read/write separation ensures diagnostic queries use read-only access while remediation requires explicit approval.
***
**Learn more**
Available models for agents.
Build agents with custom instructions and tools.
Give agents the ability to take actions.
Create APIs for Autonomy applications.
When you go on-call, the agent requests read-only credentials from 1Password to monitor your infrastructure. A human approves access, and the agent starts watching for anomalies.
When an incident occurs, a swarm of 150+ agents spins up: some inspect logs, others correlate metrics, others evaluate fixes. Each agent has its own cryptographic identity and uses the pre-approved read credentials to investigate.
```text theme={null}
Go On-Call (Read Approval) → Monitor
→ Incident → Investigate (150+ agent swarm) → Write Approval → Remediate
```
After the swarm identifies the root cause, it requests write credentials for specific remediation actions:kill runaway queries, disable a feature flag. Each write action requires separate human approval. Once approved, the swarm autonomously remediates the problem.
Here's what that looks like in code. The investigation spawns a swarm of specialist agents across every region and service, then synthesizes their findings:
```python /dev/null/conceptual.py theme={null}
from autonomy import Agent, Model, Tool
# ...
# 3 regions × 10 services × 5 specialists = 150 diagnostic agents
regions = ["us-east-1", "us-west-2", "eu-west-1", ...]
services = ["api-gateway", "user-service", "order-service", ...]
specialists = ["database", "cache", "network", "resources", "logs"]
# Each specialist type has its own diagnostic tools
def tools_for(specialist):
# database → query connections, find slow queries
# cache → check hit rates, memory pressure
# network → check latency, packet loss
# resources → check CPU, memory, disk
# logs → search for errors, trace requests
return [...]
# Define an agent and start investigation
async def investigator_agent(specialist, service, region, incident):
agent = await Agent.start(
node,
instructions=f"You're a {specialist} diagnostic agent for {service} in {region}...",
model=Model("claude-sonnet-4-5"),
tools=tools_for(specialist),
)
return await agent.send(f"Investigate {incident}")
# 150 specialized agents, operating in a parallel scatter/gather pattern
findings = await asyncio.gather(*[
investigator_agent(specialist, service, region, incident)
for region in regions for service in services for specialist in specialists
])
```
The complete source code is available in [Autonomy examples](https://github.com/build-trust/autonomy/tree/main/examples/oncall).
***
## Try it
Complete the [steps to get started](/docs/get-started) with Autonomy.
```bash /dev/null/terminal.sh theme={null}
curl -sL https://github.com/build-trust/autonomy/archive/refs/heads/main.tar.gz | \
tar -xz --strip-components=2 autonomy-main/examples/oncall
cd oncall
```
This creates the following structure:
```text File Structure: theme={null}
oncall/
|-- autonomy.yaml
|-- secrets.yaml.example
|-- images/
|-- main/
|-- Dockerfile
|-- requirements.txt
|-- main.py # FastAPI + Monitoring Agent + Diagnostic Swarm
|-- index.html # Real-time D3.js visualization dashboard
|-- op-connect/ # 1Password Connect server
```
Create `secrets.yaml` with your 1Password Connect token:
```bash /dev/null/terminal.sh theme={null}
cp secrets.yaml.example secrets.yaml
```
```yaml secrets.yaml theme={null}
OP_CONNECT_TOKEN: "your_1password_connect_token_here"
```
Add your 1Password Connect credentials file. In the [1Password developer portal](https://developer.1password.com/), create a Connect server and download the credentials file. Save it to:
```text /dev/null/path.txt theme={null}
images/op-connect/1password-credentials.json
```
This file is gitignored and required for the 1Password Connect container to authenticate with your vault.
```bash /dev/null/terminal.sh theme={null}
autonomy
```
Once deployed, open your zone URL in a browser to access the incident response dashboard.
```bash /dev/null/terminal.sh theme={null}
# Trigger a cascading failure scenario
curl -X POST https://YOUR-ZONE-URL/incidents \
-H "Content-Type: application/json" \
-d '{"anomaly_type": "cascading_failure", "severity": "critical"}'
```
Watch the dashboard as 150+ agents spawn and investigate the incident in real-time.
***
## How it works
The application demonstrates a complete incident response workflow with secure credential handling.
**Monitor.** A long-running `Monitor` starts when the app deploys and continuously watches for anomalies. In production, it would poll Prometheus, CloudWatch, or other metrics sources. For demos, anomalies are triggered via the `/incidents` endpoint.
```python images/main/main.py theme={null}
class Monitor:
"""Watches for anomalies and spawns diagnostic investigations."""
async def start(self, node: Node):
self.node = node
self.running = True
self._monitor_task = asyncio.create_task(self._monitor_loop())
async def _monitor_loop(self):
"""Background loop that checks metrics. In production, polls Prometheus/CloudWatch."""
while self.running:
# In production: check metrics here and call trigger_anomaly() when thresholds exceeded
await asyncio.sleep(30)
```
**Two-phase credential approval.** The system uses a two-phase approach to balance investigation speed with security:
**Phase 1: READ credentials** : When you go on-call, the agent requests read-only credentials to monitor infrastructure. These are approved once at activation and shared across all diagnostic agents when an incident occurs.
```python images/main/main.py theme={null}
# READ credentials needed for monitoring (requested at activation)
MONITORING_READ_CREDENTIALS = [
"op://Infrastructure/prod-db-readonly/password",
"op://Infrastructure/prod-db-readonly/username",
"op://Infrastructure/prod-db-readonly/server",
"op://Infrastructure/aws-cloudwatch/credential",
"op://Infrastructure/k8s-prod-readonly/credential",
]
```
**Phase 2: WRITE credentials** : After diagnosis, if the swarm identifies remediation actions (kill queries, disable feature flags), it requests write credentials for each specific action. These require individual human approval.
```python images/main/main.py theme={null}
# WRITE credentials - require separate approval per action
CREDENTIAL_CATEGORIES: Dict[str, CredentialCategory] = {
# READ credentials - approved once, shared across investigation
"op://Infrastructure/prod-db-readonly/password": CredentialCategory.READ,
# ...
# WRITE credentials - require separate approval per action
"op://Infrastructure/prod-db-rwaccess/username": CredentialCategory.WRITE,
"op://Infrastructure/prod-db-rwaccess/password": CredentialCategory.WRITE,
"op://Infrastructure/config-service/credential": CredentialCategory.WRITE,
}
```
**Parallel diagnostic swarm.** Agents are actors in the Autonomy runtime:they don't block, allowing massive parallelism on a single machine. The investigation spawns specialized agents across regions and services:
```text theme={null}
Investigation Root
|
|-- us-east-1 (Region)
| |-- api-gateway
| | |-- database-agent
| | |-- cache-agent
| | |-- network-agent
| | |-- resources-agent
| | |-- logs-agent
| |-- user-service (5 agents)
| |-- order-service (5 agents)
| |-- ... (10 services × 5 agents = 50 agents)
|
|-- us-west-2 (Region) - 50 agents
|-- eu-west-1 (Region) - 50 agents
|
|-- Synthesis Agent (combines all findings)
```
Each specialist agent has specific diagnostic tools:
| Agent | Focus | Tools |
| ------------- | ------------------------------ | ------------------------------------------------- |
| **database** | Connection pools, slow queries | `query_db_connections`, `query_slow_queries` |
| **cache** | Hit rates, memory pressure | `check_cache_health`, `get_eviction_stats` |
| **network** | Latency, packet loss | `check_network_latency`, `trace_route` |
| **resources** | CPU, memory, disk | `get_cloudwatch_metrics`, `check_instance_health` |
| **logs** | Errors, traces | `get_application_logs`, `search_errors` |
**Synthesis and remediation.** After all diagnostic agents complete, a synthesis agent combines findings and identifies the root cause:
```python images/main/main.py theme={null}
async def run_swarm_diagnosis(node, problem, session_id, root_id, credentials):
"""Run parallel diagnosis across all regions and services.
Spawns 150+ diagnostic agents (3 regions × 10 services × 5 agent types)
all running in parallel. Agents are actors, so they don't block.
"""
targets = []
for region in REGIONS:
for service in SERVICES:
targets.append({"service": service, "region": region, ...})
# Run ALL targets in parallel - agents are actors, they don't block
results = await asyncio.gather(*[run_target(t) for t in targets])
return results
```
Each diagnostic agent runs with specialized instructions and tools:
```python images/main/main.py theme={null}
async def run_single_agent(self, agent_type, instructions, service_name, region, model):
"""Run a single diagnostic agent."""
agent = await Agent.start(
node=self.node,
instructions=f"""You are a {agent_type} diagnostic agent for {service_name} in {region}.
{instructions}
Provide a brief assessment of the {agent_type} health for this service.""",
model=model,
)
message = f"Diagnose {agent_type} health for {service_name} in {region}."
responses = await agent.send(message)
return {
"agent_type": agent_type,
"status": "completed",
"finding": responses[-1].content.text
}
```
After all diagnostic agents complete, a synthesis agent combines findings:
```python images/main/main.py theme={null}
synthesis_agent = await Agent.start(
node=self.node,
instructions="""You are a senior SRE synthesizing diagnostic findings.
Identify common patterns, determine root cause, and prioritize remediation.
List any actions requiring WRITE access as "Actions Requiring Approval".""",
model=Model("claude-sonnet-4-5"),
)
diagnosis = await synthesis_agent.send(
f"Synthesize findings: {findings_summary}"
)
```
If the synthesis identifies remediation actions, the agent requests write credentials with individual human approval for each action.
The dashboard includes a real-time D3.js force-directed graph that visualizes all agents as they spawn, investigate, and complete their work.
**POST /incidents** : Trigger an incident investigation with 150+ diagnostic agents.
**Request:**
```json /dev/null/request.json theme={null}
{
"anomaly_type": "cascading_failure",
"severity": "critical",
"message": "Optional custom message"
}
```
**Response:**
```json /dev/null/response.json theme={null}
{
"status": "pending",
"message": "Anomaly reported - monitoring agent analyzing metrics...",
"anomaly_type": "cascading_failure"
}
```
**GET /investigation/status** : Get the current investigation status.
**Response:**
```json /dev/null/response.json theme={null}
{
"active": true,
"investigation": {
"investigation_id": "abc123",
"status": "running",
"anomaly_type": "cascading_failure",
"anomaly_message": "Detected cascading failure...",
"agents_count": 150,
"session_id": "def456",
"created_at": "2024-01-15T10:30:00Z"
},
"message": "Investigation abc123 is running"
}
```
**POST /approve/** : Approve or deny credential access for an investigation.
**Request:**
```json /dev/null/request.json theme={null}
{
"approved": true
}
```
**Response (streaming):** Events indicating credential retrieval, agent spawning, and diagnosis progress.
Additional endpoints for visualization (`/graph`), history (`/investigation/history`), and health checks (`/health`) are available in the [source code](https://github.com/build-trust/autonomy/tree/main/examples/oncall).
***
## Customize for your infrastructure
The example uses mock tools and manual triggers for demonstration. To adapt for your infrastructure:
* **Connect your monitoring** : Replace the manual `/incidents` trigger with your observability stack. The `Monitor._monitor_loop()` can poll Prometheus, CloudWatch, or Datadog for anomalies.
* **Implement real diagnostics** : Replace mock tool functions with actual infrastructure queries. For example, `query_db_connections` becomes a real PostgreSQL connection pool query, `get_cloudwatch_metrics` uses the AWS SDK.
* **Map your infrastructure** : Update `REGIONS` and `SERVICES` to match your actual deployment topology. Add specialists for your stack (Redis, Kafka, etc.).
* **Configure 1Password** : Set up vaults with your infrastructure credentials. The read/write separation ensures diagnostic queries use read-only access while remediation requires explicit approval.
***
**Learn more**
Available models for agents.
Build agents with custom instructions and tools.
Give agents the ability to take actions.
Create APIs for Autonomy applications.